In this post, I am going to show you how to run a packet capture on Cisco Firepower Management Center (FMC). As we know, both FTD and FMC are Linux based which means we can rely on a few tools that are embedded in Linux operating system. In fact, when you log into the FMC or when you go into Expert mode on FTD, you will see that the majority of the commands you use are simply Linux commands.
Packet capture in FMC can be done by using tcpdump tool along with the list of options that tcpdump offers such as filtering per source, destination, port, etc. In this post, you will see how to run real-time packet capture in FMC, redirect the capture to a file, where to store the capture file, and how to download it through the GUI or to transfer it to a remote server through CLI. Let’s get started :).
TOPOLOGY:
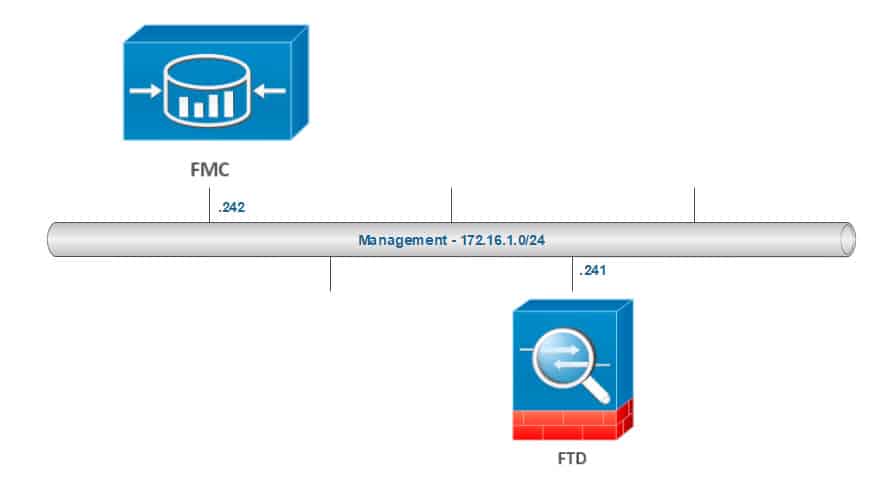
The first thing we would need to do is to find out the FMC management interface name. Typically the interface name is eth0, but let’s double check by using the Linux based command ifconfig:
admin@firepower:~$ ifconfig | grep addr
eth0 Link encap:Ethernet HWaddr 00:0C:29:25:F3:4B
inet addr:172.16.1.242 Bcast:172.16.1.255 Mask:255.255.255.0
inet addr:127.0.0.1 Mask:255.255.255.0
inet6 addr: ::1/128 Scope:Host
Now we will run the packet capture by using the Linux based tool tcpdump. In our example, we are going to apply a filter to capture the traffic between the FMC and the FTD:
admin@fmc:~$ sudo tcpdump -i eth0 host 172.16.1.241 and host 172.16.1.242
Password:
HS_PACKET_BUFFER_SIZE is set to 4.
tcpdump: verbose output suppressed, use -v or -vv for full protocol decode
listening on eth0, link-type EN10MB (Ethernet), capture size 262144 bytes
The packet capture started right after we typed the FMC admin account password. Now let’s initiate some traffic from the FTD towards the FMC, in our example we are going to initiate some ICMP traffic:
> ping system 172.16.1.242
PING 172.16.1.242 (172.16.1.242) 56(84) bytes of data.
64 bytes from 172.16.1.242: icmp_seq=1 ttl=64 time=0.450 ms
64 bytes from 172.16.1.242: icmp_seq=2 ttl=64 time=0.501 ms
64 bytes from 172.16.1.242: icmp_seq=3 ttl=64 time=0.483 ms
^C
— 172.16.1.242 ping statistics —
3 packets transmitted, 3 received, 0% packet loss, time 1999ms
rtt min/avg/max/mdev = 0.450/0.478/0.501/0.021 ms
Notice that we used the keyword system with the ping command. This keyword is used to initiate the traffic from the FTD management interface.
Now let’s stop the packet capture on the FMC by using ctrl+c, and check how it looks like:
admin@fmc:~$ sudo tcpdump -i eth0 host 172.16.1.241 and host 172.16.1.242
Password:
HS_PACKET_BUFFER_SIZE is set to 4.
tcpdump: verbose output suppressed, use -v or -vv for full protocol decode
listening on eth0, link-type EN10MB (Ethernet), capture size 262144 bytes
23:14:24.258778 IP 172.16.1.241.52171 > fmc.8305: Flags [P.], seq 808865785:808865870, ack 1163243068, win 398, options [nop,nop,TS val 660480 ecr 3614889670], length 85
23:14:24.258831 IP fmc.8305 > 172.16.1.241.52171: Flags [.], ack 85, win 597, options [nop,nop,TS val 3614919386 ecr 660480], length 0
23:14:24.291359 IP fmc.60473 > 172.16.1.241.8305: Flags [P.], seq 3833111742:3833111807, ack 1396713762, win 1414, options [nop,nop,TS val 3614919418 ecr 659883], length 65
23:14:24.291467 IP fmc.60473 > 172.16.1.241.8305: Flags [P.], seq 65:130, ack 1, win 1414, options [nop,nop,TS val 3614919418 ecr 659883], length 65
23:14:24.291672 IP 172.16.1.241.8305 > fmc.60473: Flags [.], ack 65, win 24576, options [nop,nop,TS val 660483 ecr 3614919418], length 0
23:14:24.291936 IP 172.16.1.241.8305 > fmc.60473: Flags [.], ack 130, win 24576, options [nop,nop,TS val 660483 ecr 3614919418], length 0
23:14:24.543852 IP 172.16.1.241.52171 > fmc.8305: Flags [P.], seq 85:170, ack 1, win 398, options [nop,nop,TS val 660509 ecr 3614919386], length 85
23:14:24.543892 IP fmc.8305 > 172.16.1.241.52171: Flags [.], ack 170, win 597, options [nop,nop,TS val 3614919671 ecr 660509], length 0
23:14:25.422087 IP 172.16.1.241 > fmc: ICMP echo request, id 17520, seq 1, length 64
23:14:25.422182 IP fmc > 172.16.1.241: ICMP echo reply, id 17520, seq 1, length 64
23:14:26.421963 IP 172.16.1.241 > fmc: ICMP echo request, id 17520, seq 2, length 64
23:14:26.422039 IP fmc > 172.16.1.241: ICMP echo reply, id 17520, seq 2, length 64
23:14:27.421914 IP 172.16.1.241 > fmc: ICMP echo request, id 17520, seq 3, length 64
23:14:27.421990 IP fmc > 172.16.1.241: ICMP echo reply, id 17520, seq 3, length 64
^C
14 packets captured
14 packets received by filter
0 packets dropped by kernel
It would be feasible to troubleshoot some issues directly on the terminal console. However, sometimes the packet capture might be too long for us to be able to analyze it on the terminal efficiently. In those cases we would need to redirect the capture to a file and then download it for further investigation.
Packet capture in FMC allows us to do the capture redirection, and also to download the file whether through the GUI or CLI. If we want to download the capture file through the GUI then we need to use a specific folder in which the capture file will be stored.
However, if we want to download the capture through the CLI then we can save the capture wherever we want on the FMC. Let’s have a look at the capture redirection and both examples of how we can download the capture file.
To redirect the capture to a file, we are going to use the same command as before with the addition of the -w option and the folder path where the capture file will be stored:
admin@fmc:~$ sudo tcpdump -i eth0 host 172.16.1.241 and host 172.16.1.242 -w /var/common/ftd_packet_capture.pcap
Password:
HS_PACKET_BUFFER_SIZE is set to 4.
tcpdump: listening on eth0, link-type EN10MB (Ethernet), capture size 262144 bytes
Notice the folder we used, it is /var/common in which the capture file will be stored. Also notice that when the capture is redirected to a file, we won’t see any capture on the screen. Now let’s initiate some ICMP traffic from the FTD towards the FMC:
> ping system 172.16.1.242
PING 172.16.1.242 (172.16.1.242) 56(84) bytes of data.
64 bytes from 172.16.1.242: icmp_seq=1 ttl=64 time=0.451 ms
64 bytes from 172.16.1.242: icmp_seq=2 ttl=64 time=0.459 ms
64 bytes from 172.16.1.242: icmp_seq=3 ttl=64 time=0.517 ms
^C
Similar to what we’ve done before, we will stop the packet capture on FMC by using ctrl+c:
admin@fmc:~$ sudo tcpdump -i eth0 host 172.16.1.241 and host 172.16.1.242 -w /var/common/ftd_packet_capture.pcap
Password:
HS_PACKET_BUFFER_SIZE is set to 4.
tcpdump: listening on eth0, link-type EN10MB (Ethernet), capture size 262144 bytes
^C150 packets captured
150 packets received by filter
0 packets dropped by kernel
Let’s check if now we have the capture file stored in the folder /var/common:
admin@fmc:~$ ls -l /var/common/ | grep .pcap
-rw-r–r– 1 root root 36185 Sep 15 23:32 ftd_packet_capture.pcap
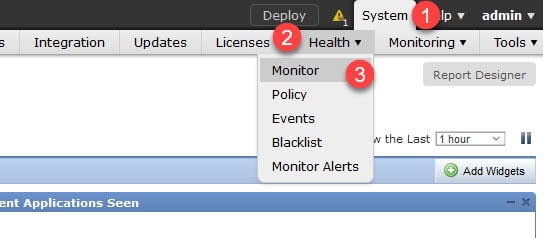
Great, we have the file as expected. Now we need to download it to our computer. The first example will show you how to download it through the GUI. To do so, we need to log into the FMC through https and then go to System -> Health -> Monitor:
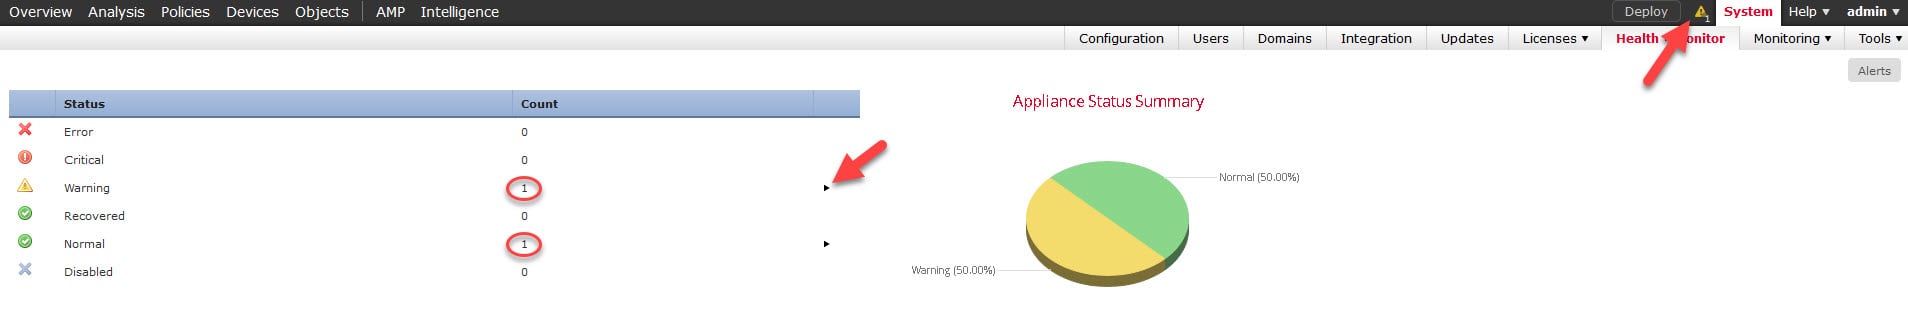
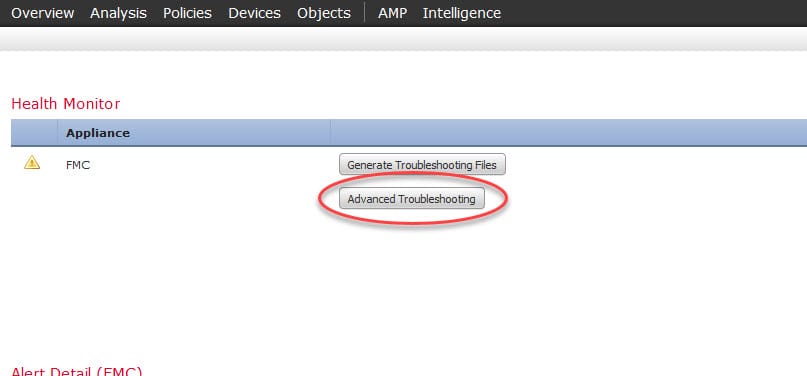
In the Health Monitor screen, we need to click on one of the status sections to find the FMC and then click on it. In the usual cases you would find the FMC under the Normal Status section. However, in this case, as you could see from the above screenshot, the FMC has a warning message. Because of this, the FMC now could be found under the Warning Status section.
In fact, by looking at the Count column, we can see that we have one device under Warning and another under Normal Status. The one under the Warning section would be the FMC, and the one under Normal Status would be the FTD.
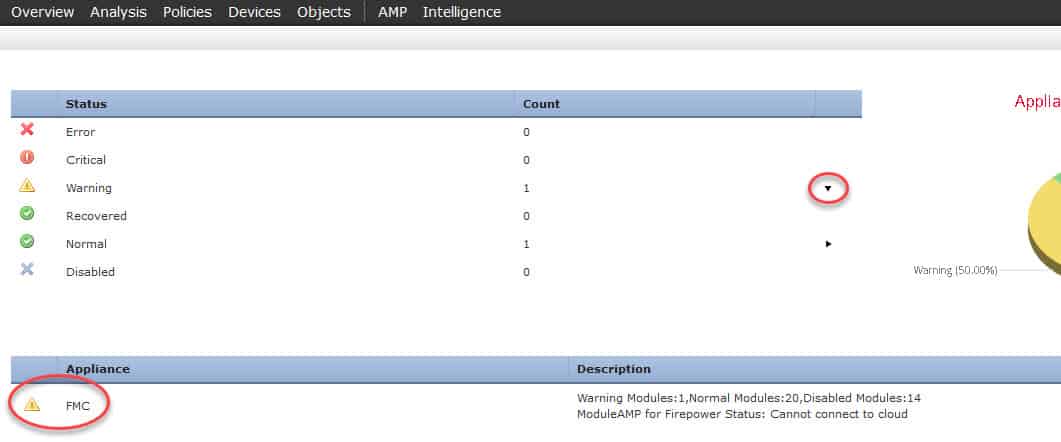
If the FMC had a critical message, we would have found it under the Critical Status section, similar to the other status sections. Now let’s open up the Warning Status section by clicking on the little black arrow:
Now we need to click on the FMC under Appliance section:
Click on Advanced Troubleshooting:
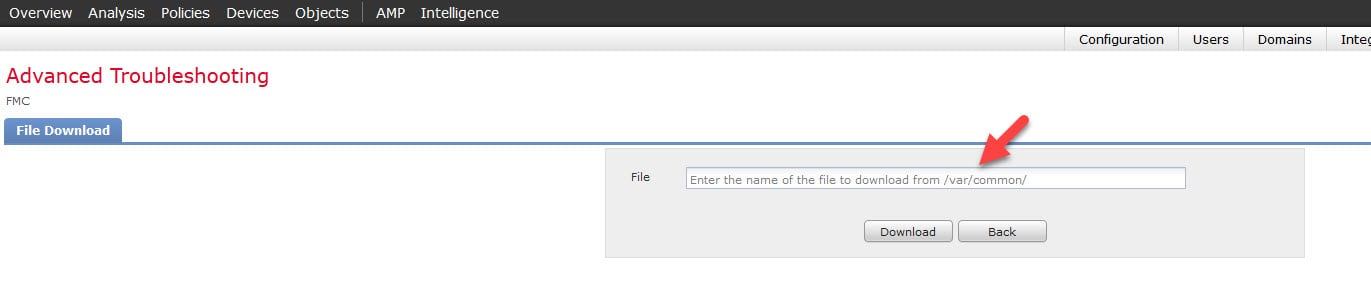
On this screen notice that it asks to enter the capture file name that was stored in the folder /var/common, and there is no way to change the folder. This is why we are restricted to store the capture file into that folder if we are planning to download the capture file through the GUI:
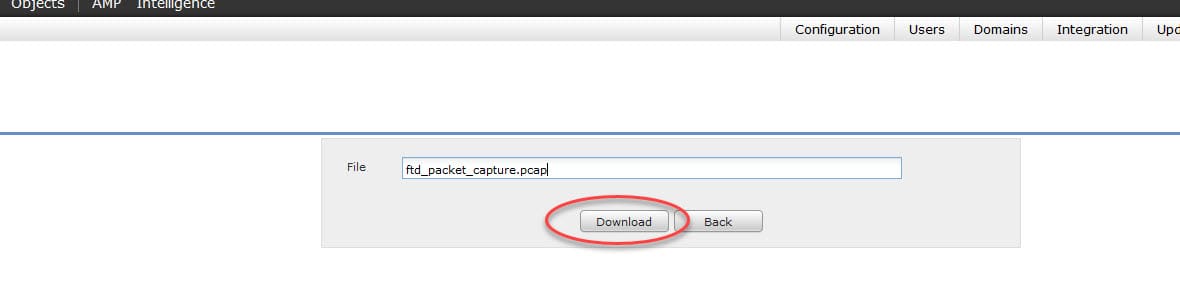
Let’s type in the capture file name we set which is ftd_packet_capture.pcap and click on Download:

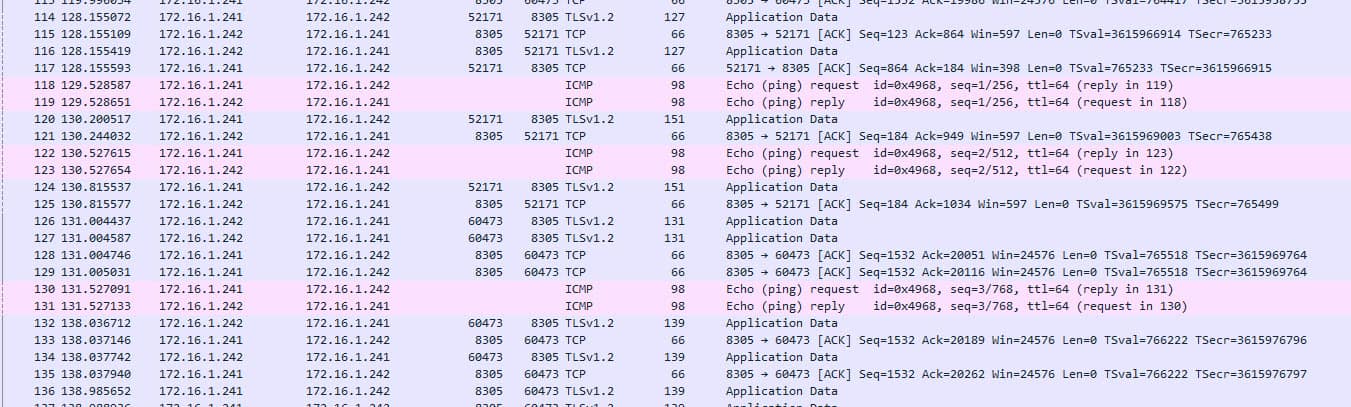
As you can see, the file has been downloaded successfully, and we could open it with Wireshark with no issues:
Now let’s try to store the capture file into a different folder and give it another name, and then try to download it through CLI:
admin@fmc:~$ sudo tcpdump -i eth0 host 172.16.1.241 and host 172.16.1.242 -w /tmp/ftd_packet_capture_2.pcap
Password:
HS_PACKET_BUFFER_SIZE is set to 4.
tcpdump: listening on eth0, link-type EN10MB (Ethernet), capture size 262144 bytes
^C8 packets captured
8 packets received by filter
0 packets dropped by kernel
admin@fmc:~$ ls -l /tmp | grep .pcap
-rw-r–r– 1 root root 945 Sep 15 23:59 ftd_packet_capture_2.pcap
admin@fmc:~$
If we try to download this capture file through the GUI we will get an error message stating that the file does not exist, but that is obvious since the GUI tries to search for the file into the folder /var/common:

Now let’s download this new file through the CLI. To do so we will use SCP, again this tool is a Linux tool and we would use it in the same way how we transfer files via SCP on Linux:
admin@fmc:~$ scp /tmp/ftd_packet_capture_2.pcap scpuser@172.16.1.200:/
scpuser@172.16.1.200’s password:
ftd_packet_capture_2.pcap 100% 945 514.0KB/s 00:00
admin@fmc:~$
As you can see, we could transfer the capture file successfully through SCP to our remote server 172.16.1.200.
I hope you enjoyed reading this post, and as always, I would love to hear your feedback. Thanks for reading!
Share via: